How to Create A Cash Flow Forecast – Part 1
The financial statements alone do not tell you what you need to know to run your business.
The standard balance sheet, income statement, and statement of cash flows (and notes) are required for a “complete” set of financial statements. Unfortunately, many owners find little value in these reports. Utility should be the basis by which you judge financial statements.
If you are like most owners, when the compiled, reviewed, or audited financial statements arrive from the CPA, you glance over the numbers quickly before handing it off to the bank or investors. In fact, the reason an audit is performed is primarily for absentee owners or bank requirements, not for the management.
The fact these financial reports are not designed for management should indicate management needs their own reports.
These financial reports are for other accountants who love financial reports, not for those who run companies. Managers care about cash and management needs reports that track cash. While it is always a great idea to have a report tracking cash in your company, the challenging financial landscape induced by COVID-19 has compounded the pain businesses are feeling and amplified the need for this report.
This is part one of a three-part blog series documenting how to understand your cash flow as it moves through your business. This will be divided into cash receipts, cash expenditures and tracking/troubleshooting the results. It is a specific “how to” process that you can follow to give you concrete actions to create this very important management report.
A cash flow forecast is a combination of the balance sheet, income statement, and statement of cash flows.
Accounting for cash runs contrary to how financial statements are setup. First, drop the ideas of revenues and expenses for this report. For this process, do not be concerned with earning revenue, accruing expenses or paying down debt or many other ideas you have about how to manage your business.
This report simply tracks how cash comes in and goes out of your company.
As such, there are components of the balance sheet, income statement and the statement of cash flows that will be incorporated into this report.
It is imperative not to confuse cash inflow with revenue or income. Likewise, cash outflows are not necessarily expenses.
To properly track cash you will need to mentally divorce the ideas of cash receipts and revenue. This report does not seek to track income and will be of no value for your year-end financial statements or tax return. There are items that have no impact on your cash currently included in your revenue. The opposite is true as well. This spreadsheet is simply a document to illustrate the flow of cash through your company.
How much of a spreadsheet jockey are you?
There are great software packages to assist you with this. I want to qualify that following this method can be time-consuming and challenging.
This method is not for everyone.
This is only for people who are very concerned with knowing the details of where all their cash is going.
Before building a detailed workbook mapping your cashflows from scratch, you should know there are software packages designed to track these details. If you are using an open API cloud-based software package, you can choose from a number of qualified software packages that can extract the data. You can then create assumptions and model out future situations based on your existing financial data.
There are many advantages to using an existing software package, including saving time, limiting possible formula errors and generating impressive reports. If you are not comfortable with spreadsheets or would rather not learn the nuances about formulas and ways to report data, this is a good option.
Even if you are comfortable with spreadsheets, they have inherent weaknesses. Due to the number of calculations, one small change in one cell can change the results of the data. Consider this study about austerity measures from 2013 referenced by congress to create in preparing a bill. It was later refuted because the analysis contained an error in the Excel formula! Even economists who have spent years working in Excel make mistakes!
A spreadsheet has advantages that software will not be able to replicate.
The reason I create this report using a spreadsheet is threefold.
- The spreadsheet is free.Whether or not you have Microsoft Excel, you can use Gsheets from Google for free with virtually the same functionality. There are no recurring fees to use this software.
- Bankers and accountants already understand spreadsheets.Accounting is primarily for communication and using methods bankers and business partners already understand makes good business sense. They can follow the logic in the report, audit calculations, and work through a workbook without the learning curve of new software.
- A spreadsheet shows all the work.Any question about where a number came from can be traced to its root. Software locks down calculations and often times hides where or how numbers are derived. While this prevents user error, it also limits the usefulness of the software. I want my clients, their bankers and all other vested parties to know what the assumptions are for their forecast.
Decide whether you want to track your cash monthly or weekly.
At a high-stress point in your business, you may want to track cash weekly. The 13-week forecast is a popular time frame for a business closely tracking cash. The amount of time and energy spent on this report increases by tracking by week but if your business is close to the brink, you will want to forecast by week. (I will use the monthly tracking for the remainder of this post.)
Use prior data and work backward to complete the forecast.
The next step is to use historical data to arrive at your information. Your current accounting system is a treasure trove of information about your cash flow. We are going to use the existing data to understand the details of your cash receipts.
Remove all non-cash income.
To do this, first export to Excel an income statement by month for the prior 12 months. (Export your data in the “Cash” basis of accounting.) You will want to pull this report for a rolling timeframe (i.e. the last complete month and prior eleven months) rather than a calendar year. The rolling nature gives you better data to use when analyzing your cash receipts. Sum the rows in a column on the right for the period.
Although your report is printed on the “cash basis” of accounting, there can still be non-cash revenue on your statement. Check through the general journal register looking for entries over the time period that effected the revenue without increasing cash. (While this is tedious, without this your cash won’t balance in the future.)
Time your cashflow by dividing monthly data by the yearly total.
Next, calculate your monthly cash receipts as a percentage for the year. This process shows when money comes into your business. It will tease out the cyclicality of your business.
Almost every business has an ebb and flow. Realtors sell in the spring, retailers and non-profits see most cash receipts in December. Even the steadiest businesses, doctors’ offices, dentists, and optometrists will see trends usually around the school year and seasonal illnesses. Dividing monthly or weekly data by the total will allow you to “time” the cash, not merely count it.
If, after dividing your granular data by the whole, you are not confident it represents the time period, go back to your historical data and repeat the process. Once you have gathered multiple years’ data, average it out.
This is an example of a non-profit’s cash receipts:
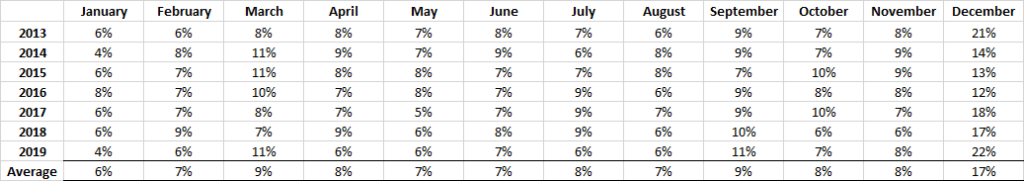
At a quick glance, you can see that December’s cash receipts almost doubles any other month. This seasonality will create cash flow variances when compared to steady cash outflows such as payroll. Repeating this process for each major revenue line will allow you to time major revenue codes.
Use this approach when budgeting too. Instead of simply allocating a lump sum for the annual budget, multiply it by the expected monthly cash percentage to forecast the cash receipts for the next year. This will be much more meaningful than dividing the annual number by 12 and using the same revenue number for each month.
Transfer prior data to a separate sheet to understand your revenue components.
Timing the cash is essential for the flow but knowing the component pricing is equally as important. The next step is to dissect the revenue number to its components.
With your rolling 12-month revenue, transfer that to a new sheet broken down by month. Add some rows between the revenue items so you can include pricing and quantity for each revenue code. For each major revenue code, research the specifics of the cash inflows from the prior 12 months. Work backward from the revenue number to understand its components. (This may involve reviewing invoices to see the pricing details.)
Every manager can better understand their business by understanding its revenue components. For example, sales for the month of January were $20,000. That number may consist of 10 units sold at an average of $2,000/unit. Common examples of variable components include seats charged, session count, billable hours, number of patients and average bill per customer.
Here’s an example of a detailed breakdown of cash receipts components:
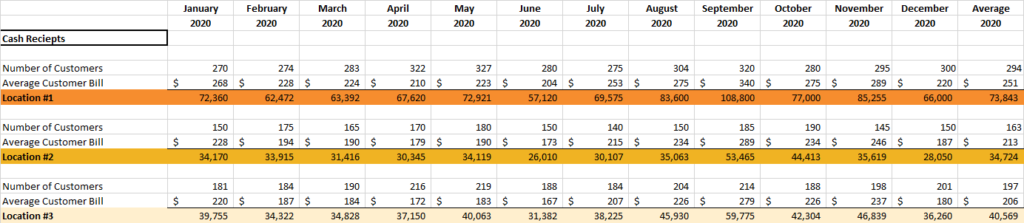
The component pricing is more usable as you see the prices and quantities change by the month. After you know the quantity demanded and prices paid for a period, you can update your forecast based on what the market is demonstrating.
You can create a cash receipt forecast that can be easily updated based on the current market conditions by timing your cash receipts and knowing the details of the quantity sold at a specific price.
Include all non-primary cash receipts.
This is not a budget. There cash receipts that will not show up on your income statement (at least not in the revenue section). Forecast these cash receipts as well.
Common non-revenue items to track for cash receipts include loan proceeds received, net accounts receivable collected, sales of capital assets and insurance proceeds received. While these do not necessarily impact the income, they do impact the cash balances and need to be included.
Tracking cash receipts is the first step to understanding your cash flow.
Just as revenue is the starting point to a budget, tracking cash receipts is the first step to understanding your cash flow. Understand the cyclicality of your business, the price and quantity of the components of your revenue and incorporate cash inflows other than sales. When you have a solid grasp of your cash receipts, you can move on to the outflows.
How else do you track your cash receipts? Do you currently use a separate spreadsheet to track your cash flow?