Running an MSP means managing the revenue and expenses of multiple service lines, from projects to managed or application services to software, hardware, and even commissions. Discovering which of these areas is truly profitable is one of the most difficult and critical aspects of managing your business.
Where things get especially complicated is in the shared-resource allocation of your staff. MSP owners constantly grapple with questions like:
- Who’s doing what?
- How much time is spent delivering services vs. managing people?
- Are we overstaffed in management? Understaffed in delivery?
These questions become even harder to answer when team members wear multiple hats. In a small MSP, that’s almost always the case.
The Challenge of Hybrid Roles
In smaller MSPs, it is rare to have dedicated roles for each service line. Most people rotate between responsibilities and service lines. A service manager might also handle tickets. An engineer might run onboarding and also supervise a pod of technicians.
That’s perfectly normal.
However, if you want your profit & loss statement to reflect reality and accurately benchmark your business to the industry’s best, you must split these hybrid roles in your MSP appropriately between the cost of goods sold (COGS; service delivery) and operating expenses (management/admin).
Why This Matters: Gross Margin Accuracy
Gross margin on service labor is one of the clearest indicators that you are running an efficient MSP, but if someone’s time is misclassified, you’re distorting your margins and creating a false picture of profitability. For example, lumping a player/coach’s full salary into expenses leads to poor decisions like:
- Hiring when you’re already overstaffed
- Undercharging for services
- Failing to invest in scalable delivery models
To put it simply: blurry roles create foggy financials.
The Purpose of Your Profit & Loss is to Create Clarity to Help You Manage Your Company
Your financial statements are not just for filing taxes. They are a communication tool and a window into your business.
When built correctly, they help you:
- See when it’s time to pull a manager fully out of delivery
- Know what your salary cap is for hiring on your service team
- Understand if management is overbuilt or underperforming
- Grow intentionally, with clarity and control
Upon seeing the results, one client, benchmarking for the first time, exclaimed to us,
“After years of running my MSP, I finally saw a P&L that matched what I felt in my gut. It finally made sense.”
That’s the power of proper benchmarking and allocating the hybrid roles in your MSP.
Profit & Loss Comparison: Before vs. After Allocation
Benchmarking only works when you’re measuring against clean, comparable data. Allocating salary based on gut feel or sticking to payroll line items by default isn’t enough. You must be intentional about representing reality.
Ask yourself: How is this person really spending their time?
Consider an example of four employees splitting their time between managing and service. Their payroll report categorizes their salaries in Salaries – Admin/Management but, after reviewing their time cards, they determine 70% of their time is dedicated to client facing work with only the remaining 30% in coaching one-on-ones or leadership meetings. Assume each one makes a $100,000 salary. In this scenario, 70% of their salary (plus taxes and benefits) belongs in COGS, and 30% belongs in G&A or Operations.
Some MSPs track time to the quarter hour and know exactly where everyone’s time goes. Others estimate their service vs. management responsibilities based on days of the week or weekly routines. The key is not precision but consistency. Your method doesn’t have to be complex—but it does need to reflect reality. For simplicity, round the allocation to the nearest 5 or 10%.
This is not a “set it and forget it” policy. Your company is dynamic. Roles shift. Responsibilities change. To stay accurate, update your allocations at least annually—and ideally quarterly.
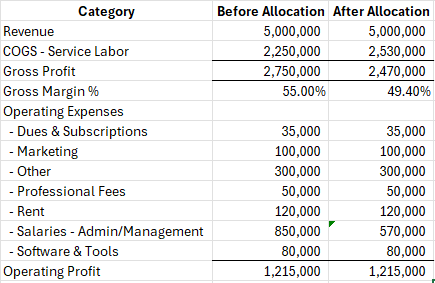
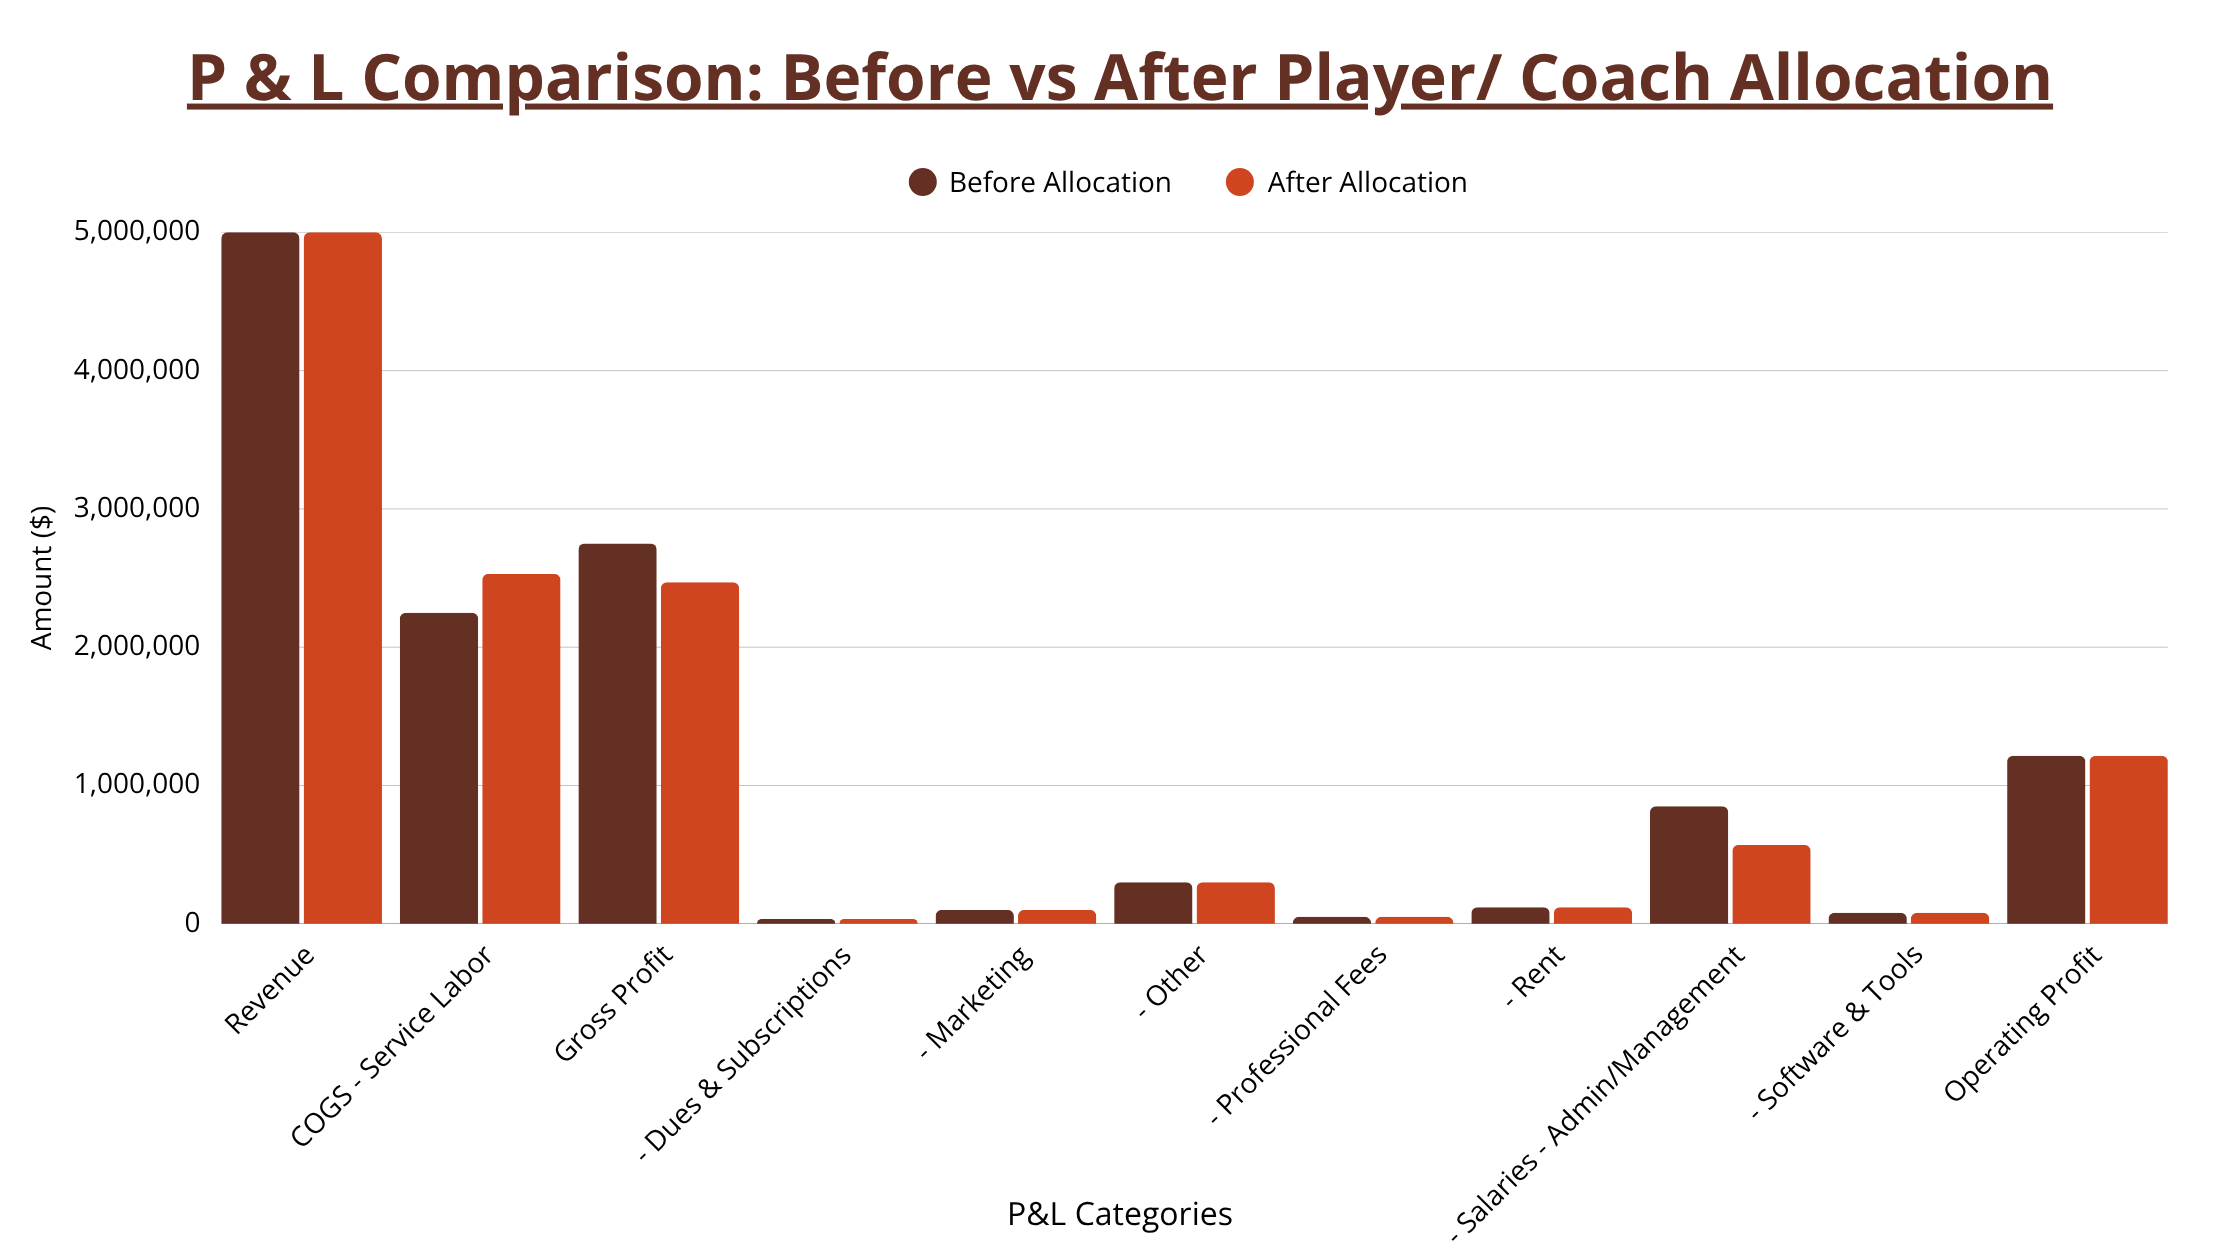
Reallocating 70% of a player/coach’s compensation from administrative overhead to COGS – Service Delivery Labor significantly shifts the financial picture. The example below removes that portion of their salaries not spent managing ($100k salary * 4 * 70%) from Salaries – Admin/Management and places it into COGS – Service Delivery Labor. Allocating $280,000 (70% of $400,000) from expenses to COGS drops the gross margin from 55% to 49.40%. While a minor adjustment, the 5+ percentage swing of gross margin normalizes their numbers and means they are not quite the outlier they were before the adjustment. The books now tell the truth about where resources are spent in the business.
(For simplicity, payroll taxes and benefits were not moved to COGS in this example. Moving those would impact the gross margin % even more.)
The P&L would look like this:
A more accurate gross margin gives you the insight you need to:
- Price services with confidence
- Benchmark apples-to-apples with peer MSPs
- Know when it’s time to hire or restructure
Think of this as moving from “blurry” to “in focus.” The closer your financials reflect operational reality, the better your strategic decisions will be.
How to Allocate Hybrid Role Compensation
Use this checklist:
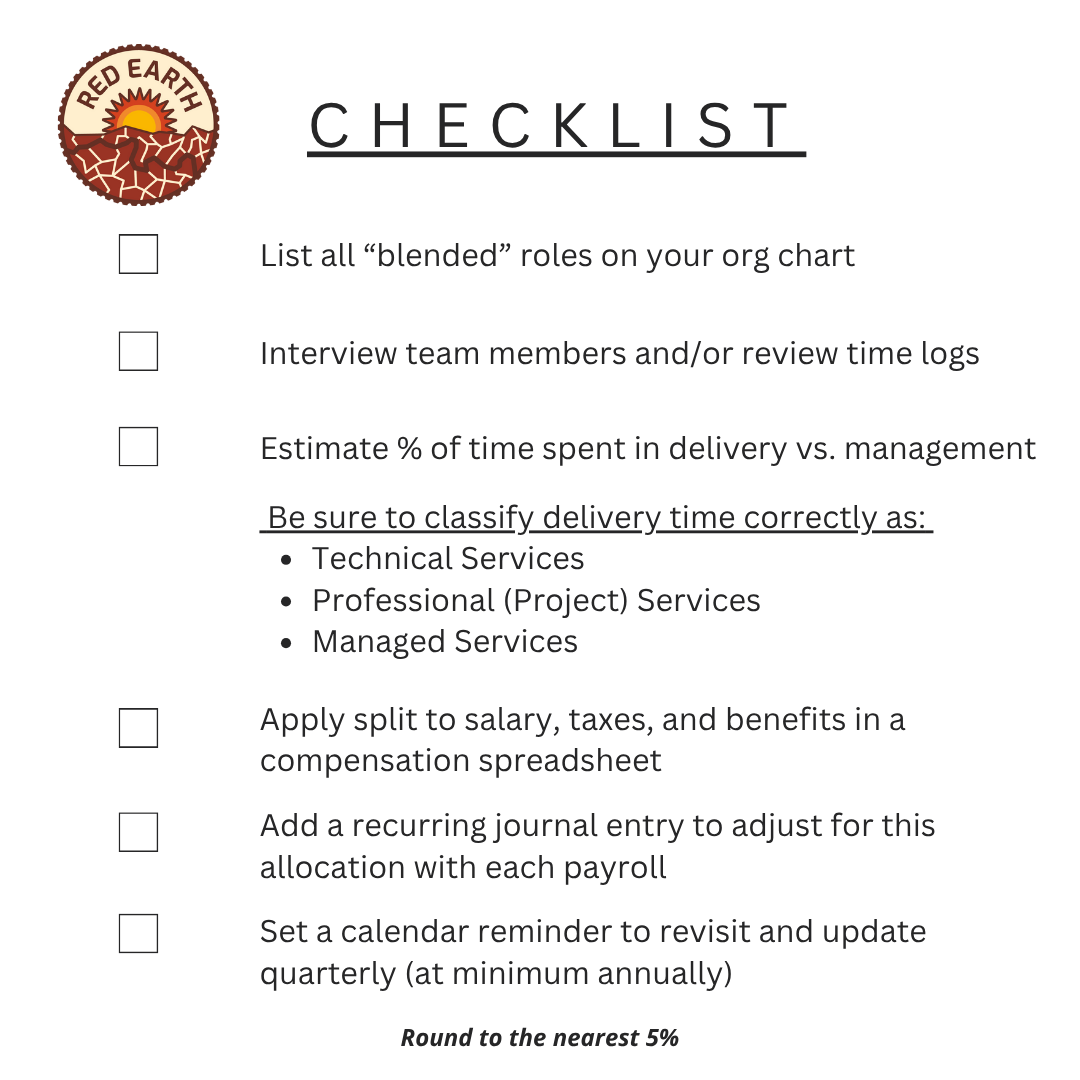
This isn’t a “set it and forget it” process. Your team evolves, responsibilities shift, and your allocations should reflect those changes.
Recommended Resources
Ready to Get Clarity?
If you’re ready to stop flying blind and start managing with insight, we’re here to help. Whether you need help with hybrid roles in your MSP, aligning with SLI standards, or overhauling your financial foundation, we’ve got you.